Public Polling Actually Understates Trump's Support Among Republicans
September 16, 2015
What’s the deal with Trump support?

Like many a Jewish public opinion researcher, this past weekend I found myself sitting at a Rosh Hashannah dinner table talking with people about of all things, Donald Trump. Anticipating this, I dug a bit into ‘the Donald”s numbers in publicly available top-line polling data in an attempt to gain some semblance of a nugget to share with my dining companions.
What I found was fascinating and sheds a valuable light on Donald Trumps candidacy and public opinion on controversial people and issues in general.
The Data
As one does, whenever I want to know the lowdown on publicly available polling data, I always head to the Huffington Post’s HuffPost Pollster website. Luckily, the site also provides a free and open API for bulkdownloading the data that backs the site for analysis by anyone. Access to this data is made incredibly easy by the various language-wrappers around the API including the pollstR R package developed by Jeffrey Arnold at the University of Washigton, that I used in this instance.
The HuffPost Pollster API contains a lot of interesting data and metadata about the polls it tracks in its database. It contains information on when the poll was fielded, the party affiliation of the pollster, the universe of voters the poll was intended to measure, and the method by the which the poll was conducted, among other things. This critical tracking of informatio is a true public service and would have made this analysis particularly difficult to do.
Mode Differences & Social Desirability Bias
Ever since this years’ AAPOR conference in Florida I have become fascinated by the potential for the mode of interview of a survey to not only reach different populations but incentivize respondents to give different answers to very similar questions.
At the conference, the Pew Research Center presented a fascinating set of findings (available here) on this so called ‘mode effect’ on all different kinds of political attitudes. The crux of the report was that these mode effects are real and are driven in part by the different kinds of people who participate in online surveying but also the way the survey is administered, with no actual interviewer (as is standard practice in live telephone surveys).
When there is no interviewer, respondents give different answers than their counterparts who answer live telephone surveys. This is consistent with social desirability bias, where the respondents modifies their behavior because they are interacting with another person. In the Pew research this showed up in two interesting ways. One, respondents showed less favorable opinions about politicians in general in the online setting than on the phone. They also registered lower levels of satisfaction with family life and were less likely to perceive that certain groups are discriminated against.
All three of these question topics are ones where we might expect that being in a social situation with an inteviewer (even an anonymous one over the phone) might ‘bias’ a response in the direction of seeming 1) less angry about political leaders, 2) more satisfied with life in general, and 3) holder of less controversial statements than they might reveal otherwise. All of these things exist supposedly because of the perceived (even if it is silent) judgement of an interviewer and it’s exactly what we see illustrated in the graphic below.

The Viz
I find this research utterly fascinating and have been searching for other examples of it in current polling data. While I’m not the first person to notice this, I figured I’d put it out in the open:
Donald Trump shows a moderate but significant mode effect in all the data to date (in the name of open science and visualization, I’ve posted all my R code that I used to create the graph below to a Github gist that I’ve hosted below).
In the graph below, I plot the time series of Trump support among Republicans (a mix of registered voter, adult, and 2016 likely voting) broken out by whether a poll had any interviewer at all (live telephone interviewer or even a mix of live/Internet) as compared to polls that had no interviewer whatsoever involved in the process (IVR and internet only polls). From there I plotted the raw data, fit a loess smoother to plot the trends (weighted by the sample size of the poll and nothing else) and produced standard error confidence bands at the 90% level to properly illustrate the uncertainty in the smoothed polling estimates. What you can see below is that consistent with a mode effect, Trump support among polls without an interviewer has been anywhere from five to ten points higher than in polls with interviewers since Trump’s rise in the polls began in July. No other Republican or Democratic candidate displays this behavior (this chart is easily reproducible given the Gist posted below) and throughout Trumps rise the differences between the two lines meet this semi-standard threshold for statistical significance (whatever that means).
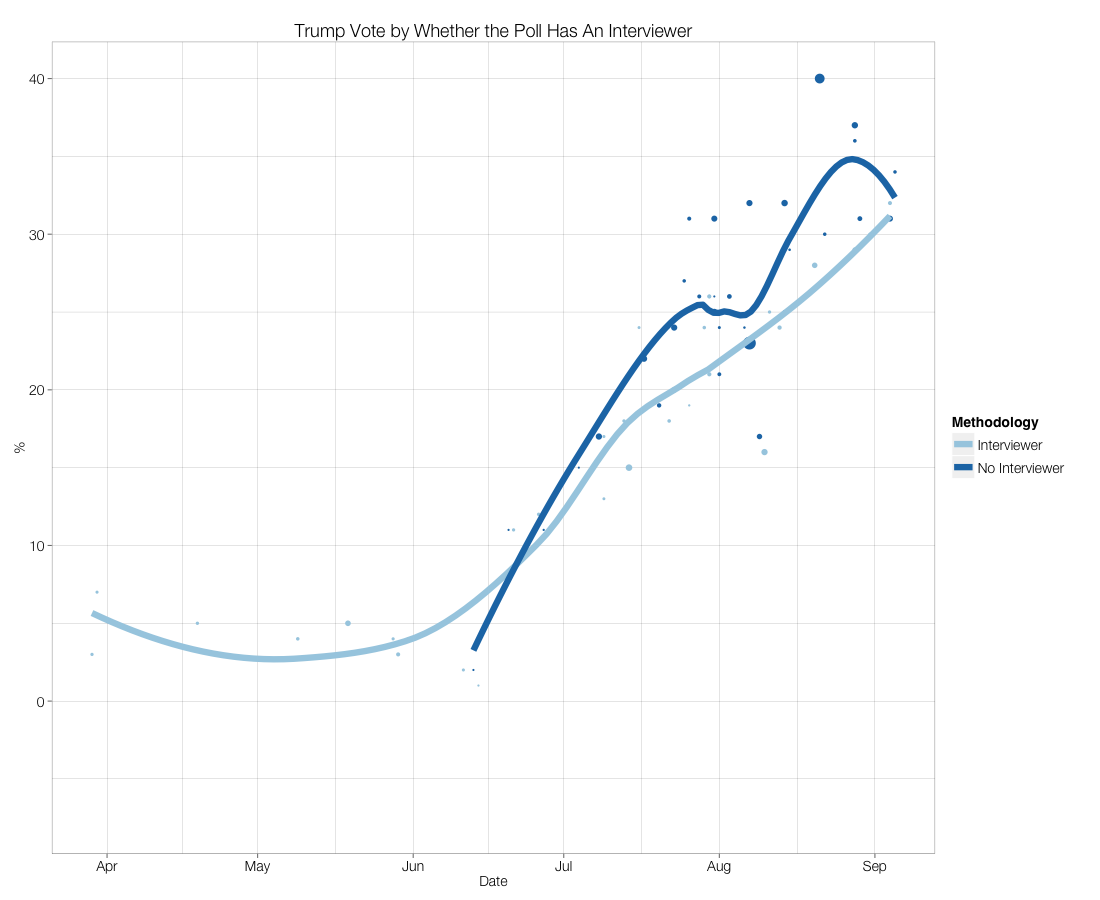
Whether this means that the Donald is really up by 5 or 10 points is up for debate. For one, at this exact point in time the mode effect seems non-existent and has coincided with Trumps meteoric rise in the polls. Perhaps then it might be more accurate to say that public polls may ‘have’ understated Trumps support in the past. Either way the fact that some survey respondents are more reluctant to admit to liking Trump if they take a survey on the phone than over the internet is a fascinating kernel in a Presidential election cycle that is just getting started and something to keep a watchful eye on as the news media discovers and scrutinizes Presidential hopefuls.
Gist + Errata
Thanks to Mark Blumenthal, David Shor, and David Margolis for helping me make sense of this nugget. They are in no way responsible for my sub-par prose.