I asked a biased sample of people what they think the electorate will look in 2016, here's what I learned.
November 7, 2016
“It all comes down to turnout” is a phrase uttered by countless analysts, pundits, and armchair elections quarterbacks alike. Over 4 days from September 30th to October 4th I surveyed the views of 400 non-random people a few questions about who they thought would vote in 2016 by pushing them to take a survey on the Survey Monkey platform. The goal here is not to ask a representative sample of individuals anything but hoping that the group of people interested in taking the survey have some insights into something that we won’t really have a great understanding of until voter files update with turnout records or at least the Census reports on voter turnout come out in the coming months.
At this moment it is impossible to validate this analysis, but I still wanted to share the responses I received. I asked anonymous coworkers, family members, journalists, academics, fellow political professionals, and the truly heterogeneous Twitter responses I received from lawyers, doctors, and the like.
The Data
I asked four main questions as well as simple standard demographic questions as well as if they were a political professional. I am also able to segment out which link survey respondents took the survey on. A social media link, one internal to where I work (Catalist) and another I sent out to the progressive analytics and data community that I am a member of.
Question 1
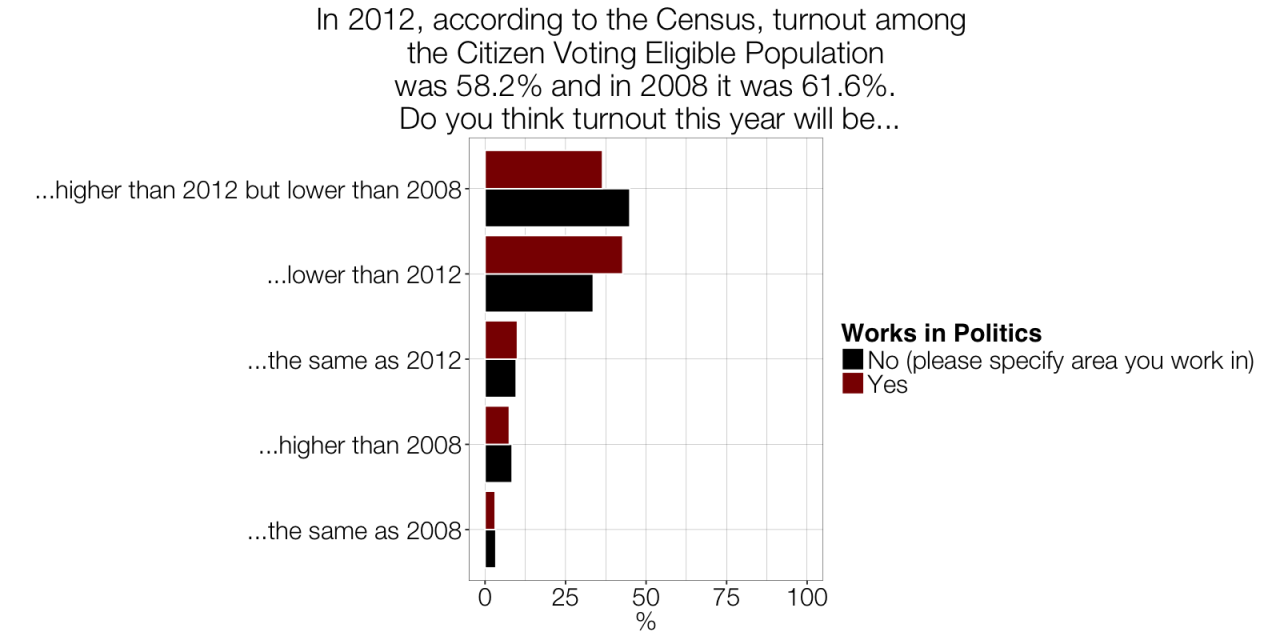
First I asked broadly about turnout levels to expect in 2016, anchoring respondents to information about 2008 and 2012 to get a good handle on potential levels of turnout, in proper context.
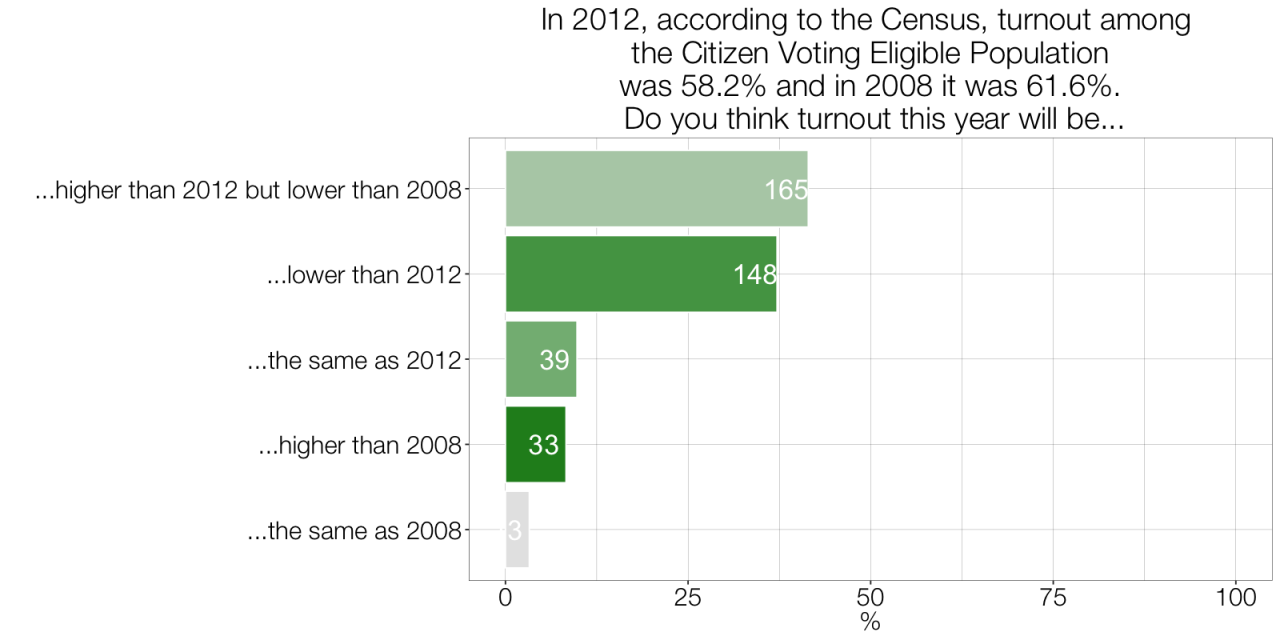
As you can see, there was disagreement about overall turnout in 2012. No response received a majority of responses. A plurality of my survey respondents thought that turnout would be higher that 2012 but lower than 2008, but almost as many thought it would be lower than 2012. Granted, the categorical responses here aren’t ideal, but clearly ‘the crowd’ doesn’t think turnout will be at 2008 levels. This went against my own response, which was at 2008 levels, especially given reports of enthusiasm and self reported interest at those levels, according to summer surveys from the Pew Research Center.
Question 2-4
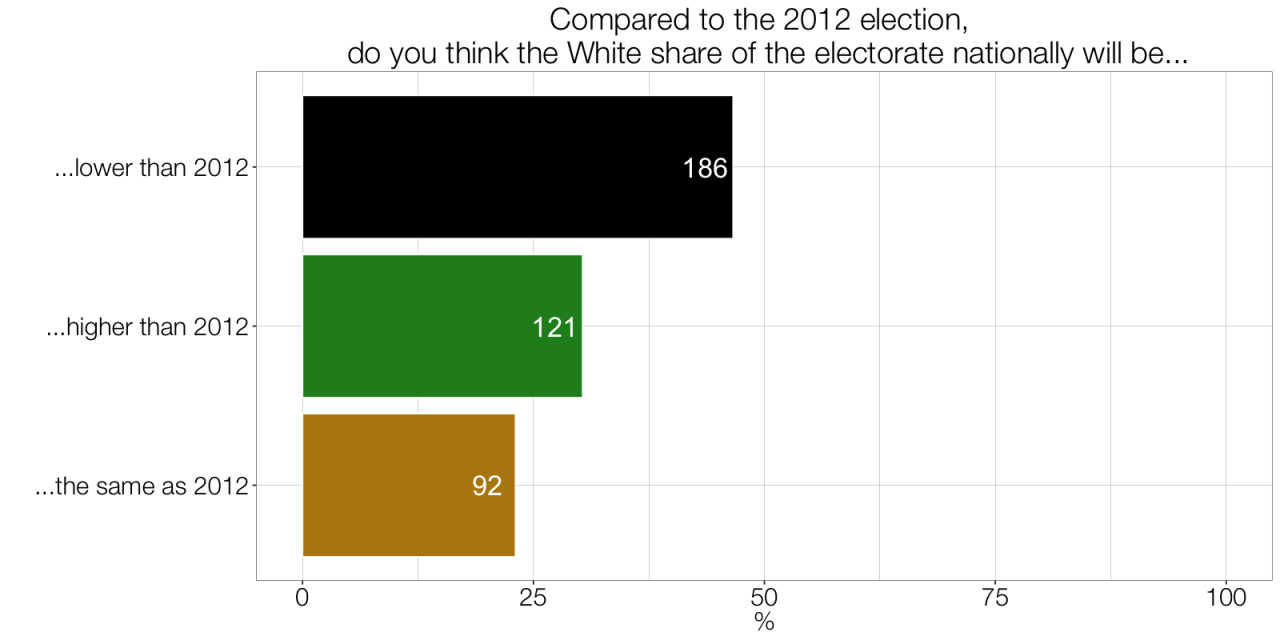
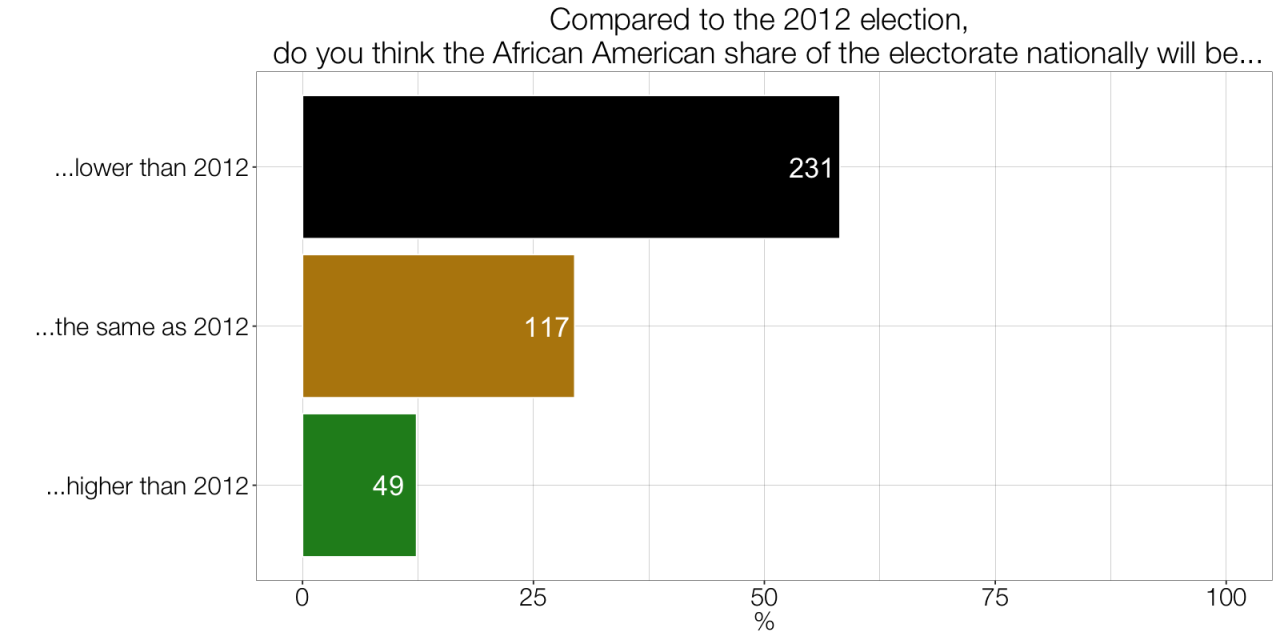
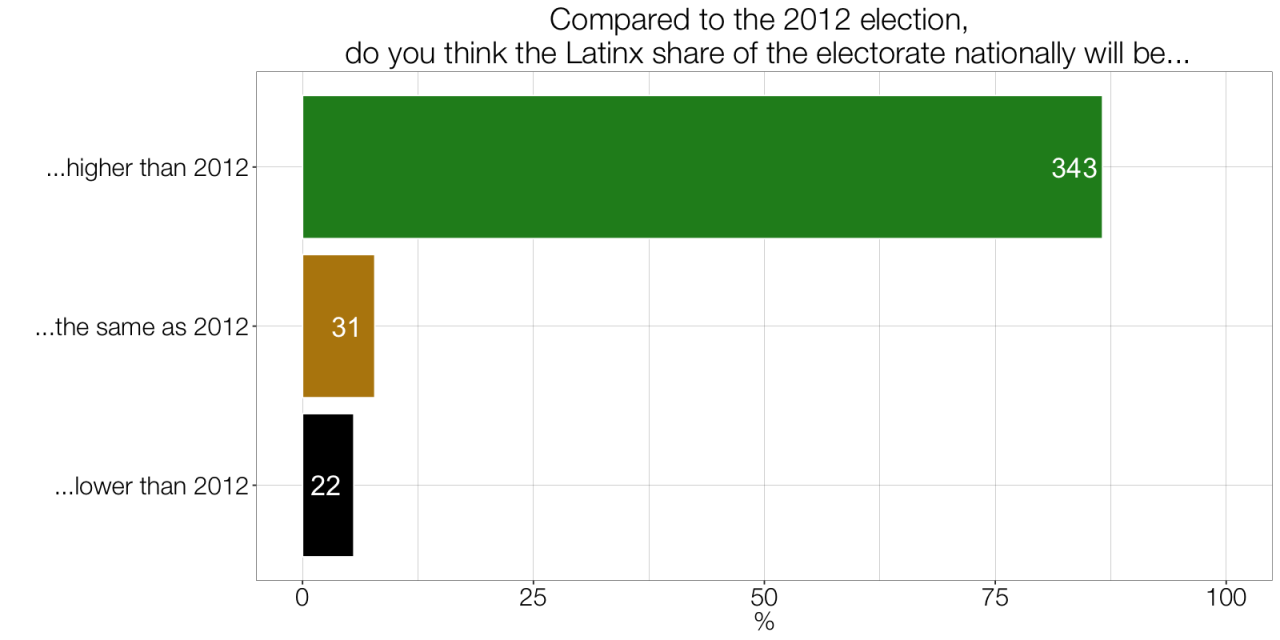
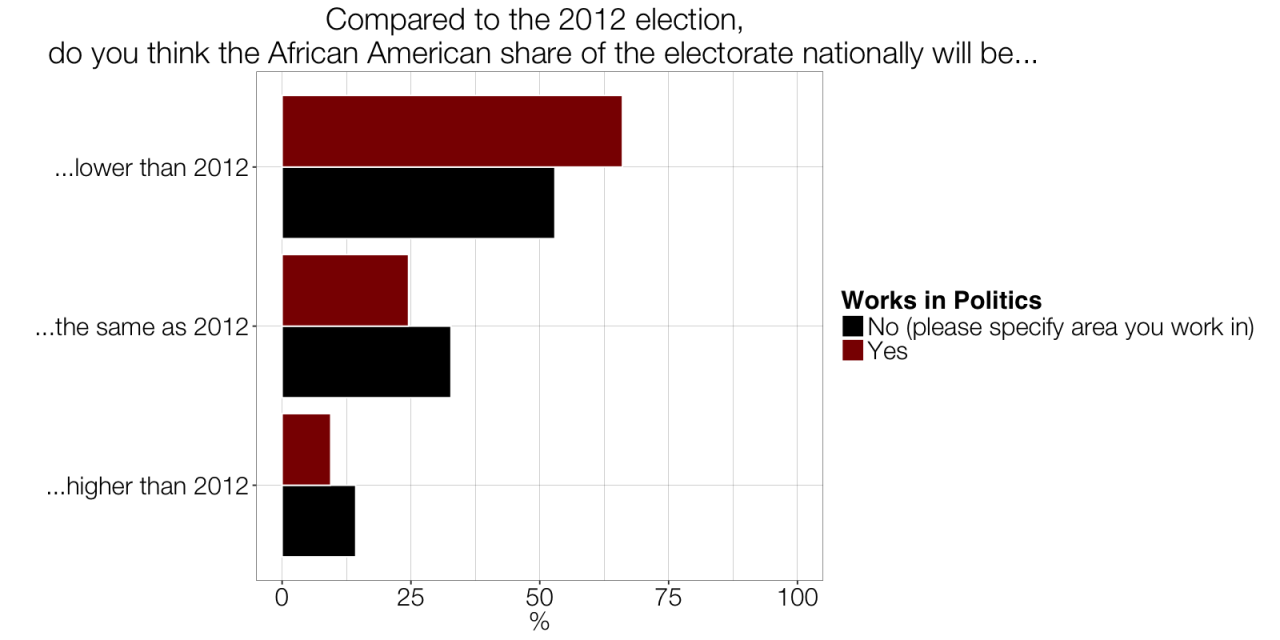
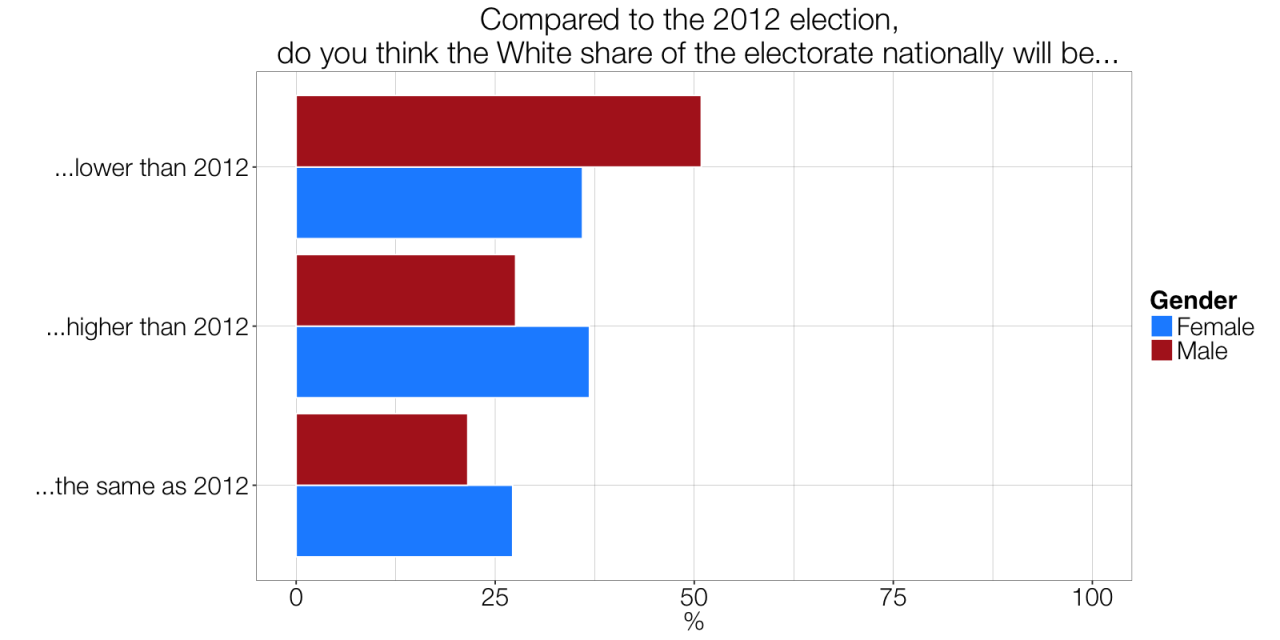
The next questions I asked were related to turnout of the biggest racial groups and their share relative to 2012. The graphs below are for White, African American, and Latinx voters. Broadly, my respondents see white turnout share increasing, replacing the Afriacn American share of voters. Unequivocally, respondents think that Latinx voters will make up a larger share of the electorate than 2012, but on average given the other two popular responses it is my guess that the expectations in the rise of Hispanic voting are not nearly as large as what early voting might suggest. If respondents on average thought that the black share would fall and White share would increase, this implies that the if the Latinx share would increase that it would not be large.
Subgroups
Given the pretty large majority of respondents who think Latinx turnout will increase, I won’t delve into those groups, but will put out 4 graphs illustrating interesting subgroups, looking at responses by self reported political professionalism and gender. There are obviously many more groups so if you have a question about a group, ask and ye shall receive.
Political professionalism
Political professionals are overall a bit more pessimistic about turnout overall and for African American voters than non political professionals.
Gender
Women are more divided than men about what the white share of turnout will be compared to 2012 than men, who think that turnout overall will be lower compared to 2012 among whites.
Thoughts, comments, questions? Drop me a line @jon_m_rob on Twitter and jonathanmrobinson2 at gmail dot com.
Addendum
Apparently PredictIt , the betting site offering odds on political events had a market made on turnout in terms of raw number of votes. The market doesn’t seem to have been very liquid until Election Night sadly. Here is the 90 day trend.
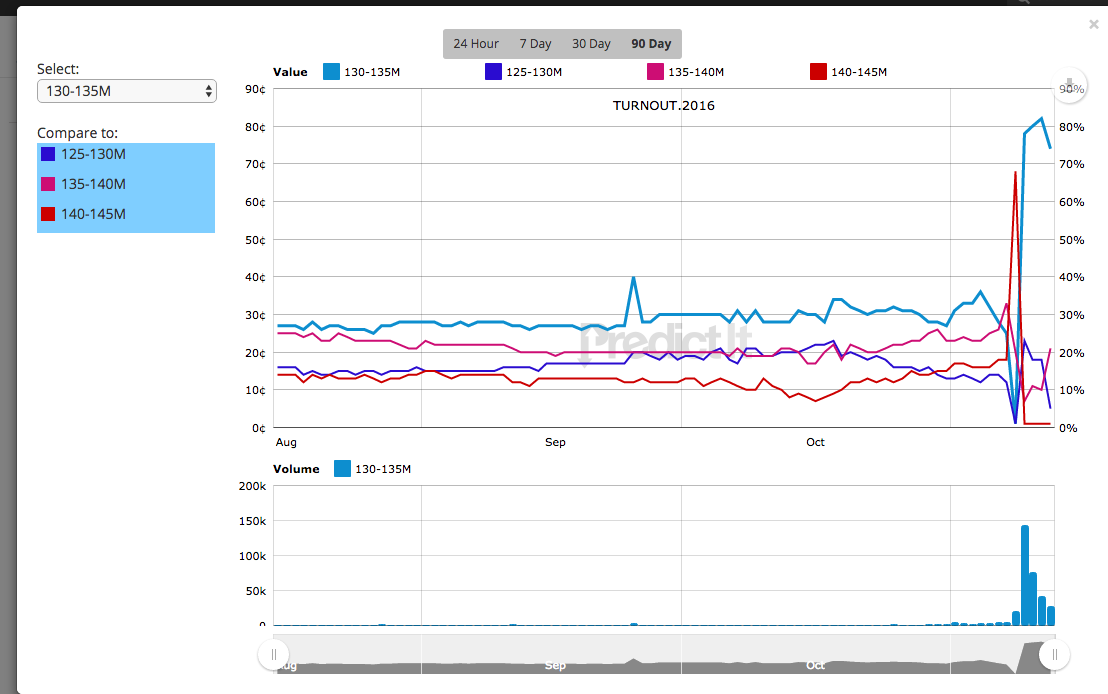
We’ll know soon enough if this indeed is true:
Clinton camp manager Robby Mook says on conf call that campaign expects turnout to exceed 2008 and 2012.
— Alex Seitz-Wald (@aseitzwald) October 6, 2016